학회 세션/비어플
[R] 데이터 불균형 해소
JEONGHEON
2022. 3. 20. 15:14
오늘은 이어서 데이터 불균형 해소를
간단한 R코드를 통해 알아보겠습니다.
2022.03.20 - [학회 기록/학회 세션] - 데이터 불균형 해소
데이터 불균형 해소
안녕하세요! 오늘은 데이터가 불균형이어서 우리가 모델링을 할 때 유의미한 결과값을 얻을 수 없을 때 어떻게 대처해야하는지를 알아보겠습니다. 예를들면 종양의 악성유무를 살펴보면 100명
tnqkrdmssjan.tistory.com
이전 발행 글은 위를 참고하시면 됩니다.
기본 데이터
# 문과(0) 이과(1)
set.seed(0320)

y = c(rep(0, 15),
      rep(1, 50))

y = as.factor(y)

math = c(rnorm(15, 50, 15),
         rnorm(50, 70, 12))

eng = c(rnorm(15, 70, 12),
        rnorm(50, 60, 18))

data = data.frame(y, math, eng)
plot(data$math, data$eng,
col=as.numeric(data$y))
table(data$y)
>>>  0  1
    15 50
랜덤 언더샘플링
문과 = data[1:15, ]
new_이과 = data[sample(16:65, 15), ]
data11 = rbind(문과, new_이과)
plot(data11$math, data11$eng,
col=as.numeric(data11$y))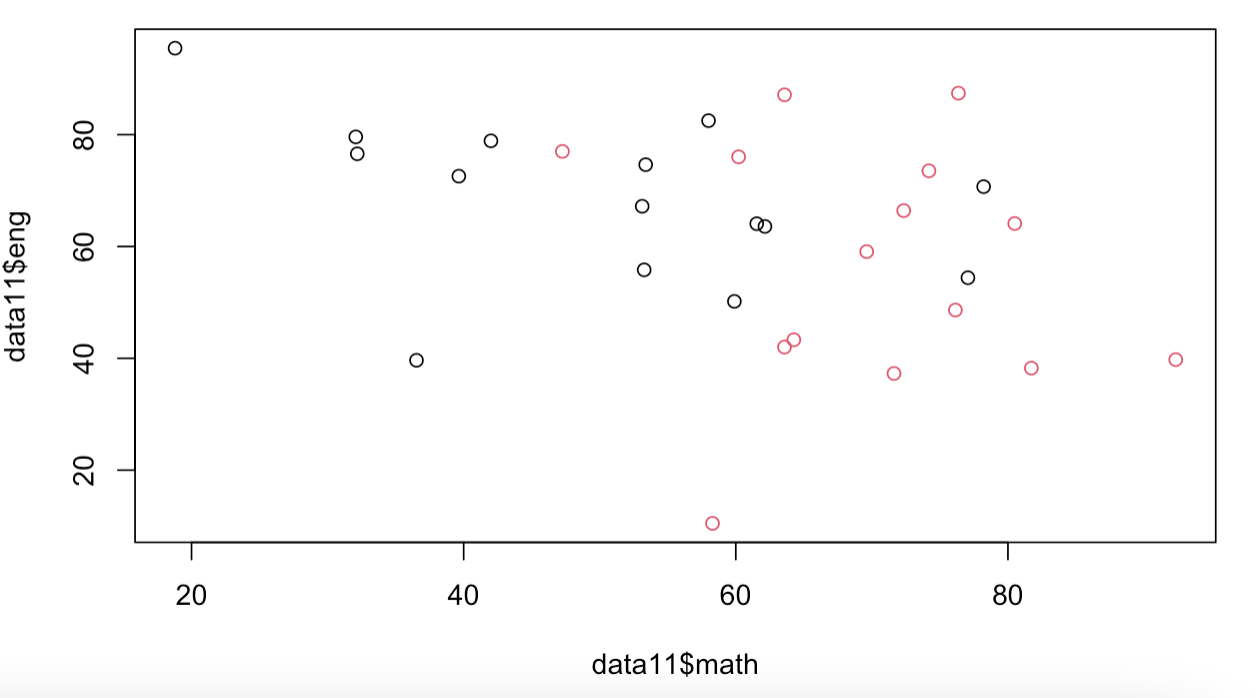
table(data11$y)
>>>  0  1
    15 15
Tomek links
library(UBL)

# 범주 1을 삭제하는Classif
TL = TomekClassif(y~., dat = data, Cl = 1)
data12 = TL[[1]]
plot(data12$math, data12$eng,
col=as.numeric(data12$y))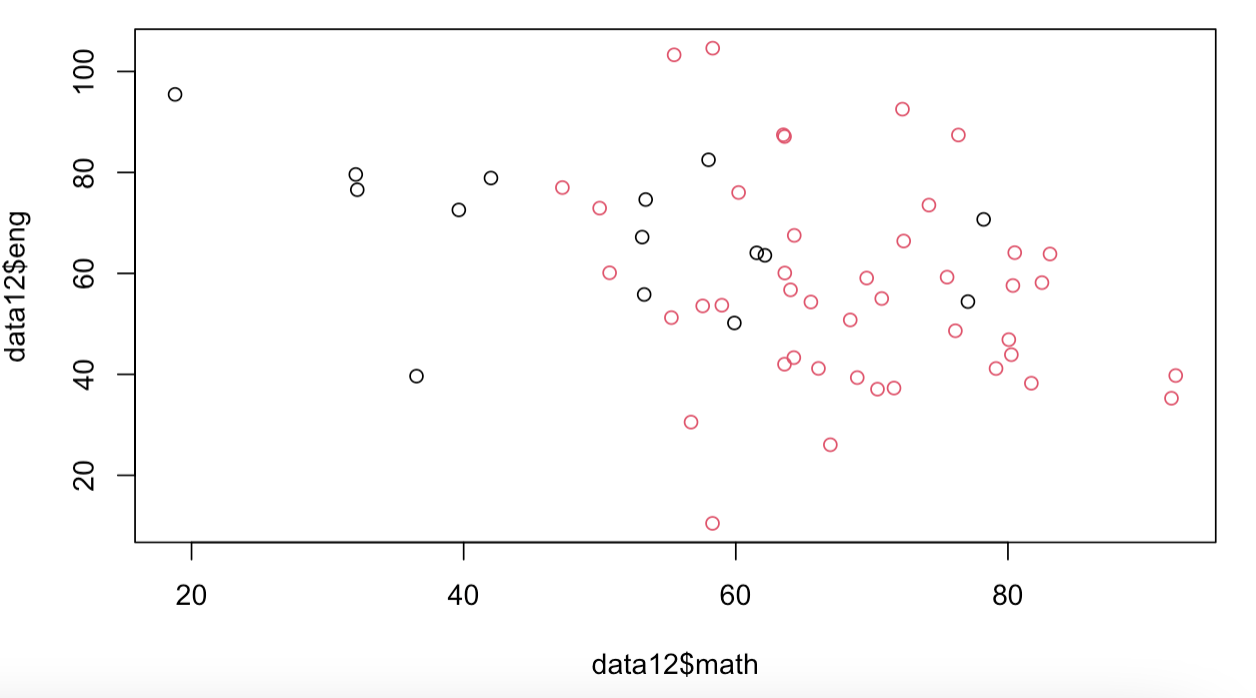
table(data12$y)
>>>  0  1
    15 43
랜덤 오버샘플링
new_문과 = data[sample(15, 50, replace=T), ]
이과= data[16:65, ]
data21 = rbind(new_문과, 이과)
plot(data21$math, data21$eng,
col=as.numeric(data21$y))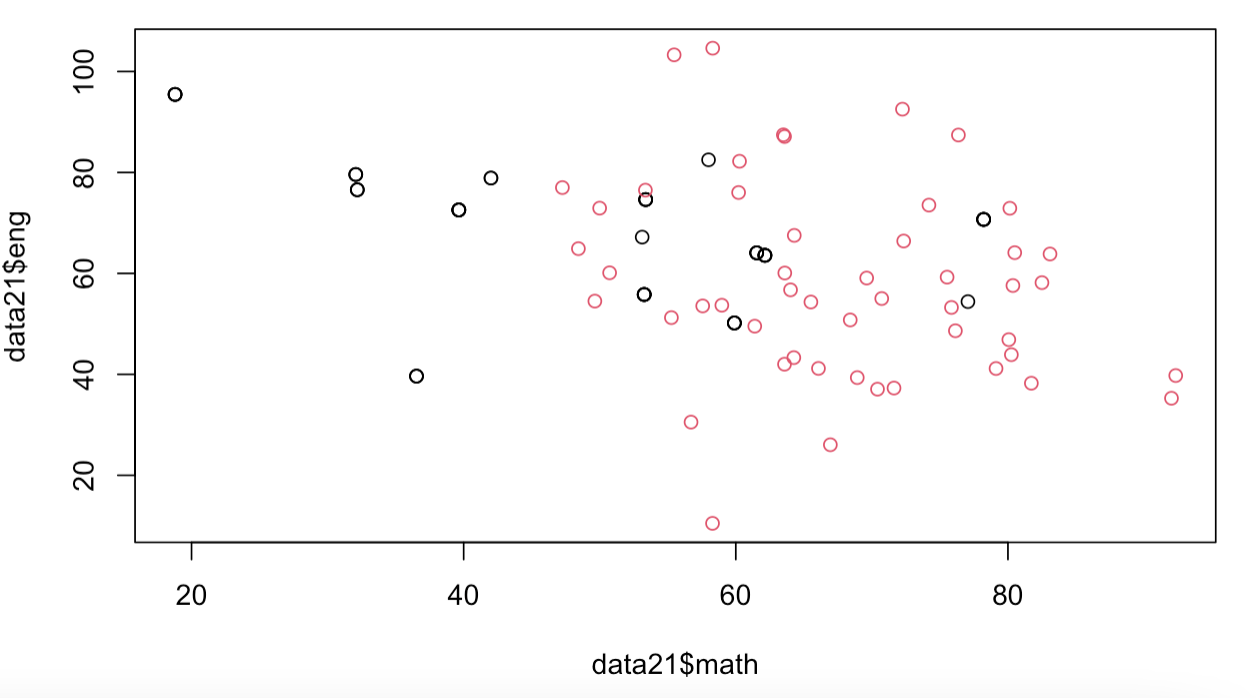
15개의 데이터가 중첩이 돼서 표시되는 것이므로 똑같이 표시됩니다!
table(data21$y)
>>>  0  1
    50 50
가우시안 노이즈
new_문과 = data[sample(15, 50, replace=T), ]
new_문과$math = new_문과$math + rnorm(50, 0, 1)
new_문과$eng = new_문과$eng + rnorm(50, 0, 1)
data22 = rbind(new_문과, 이과)
plot(data22$math, data22$eng,
col=as.numeric(data22$y))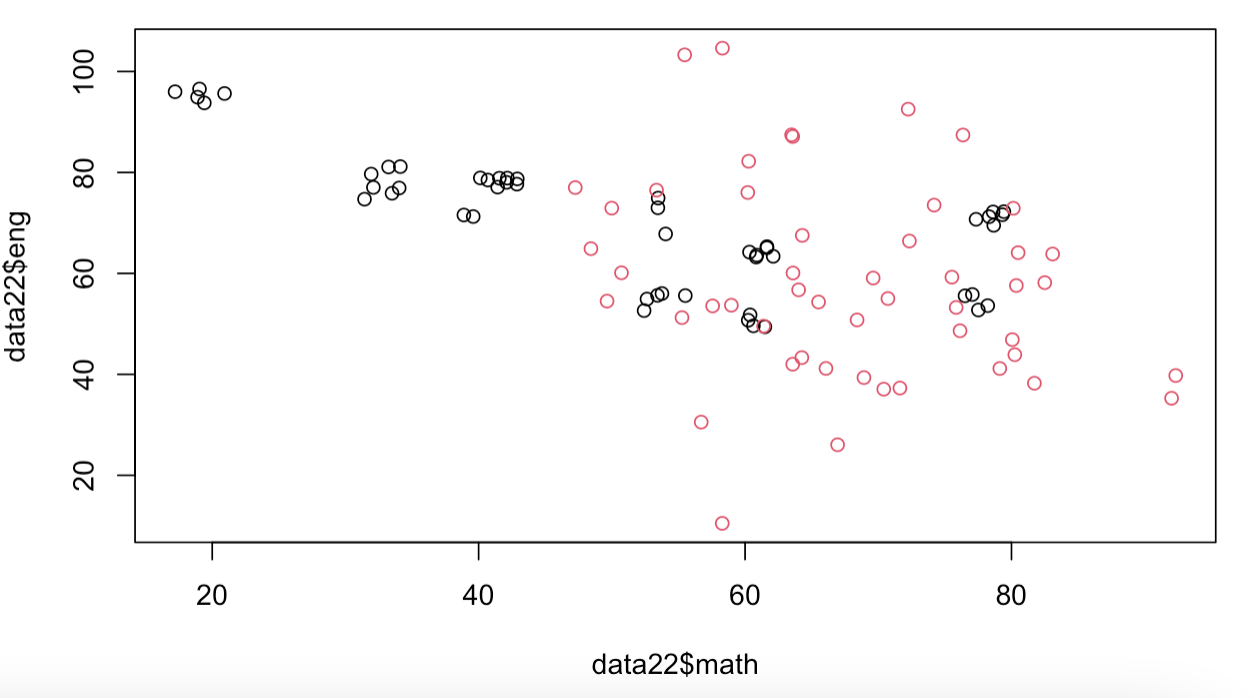
table(data22$y)
>>>  0  1
    50 50
SMOTE
library(smotefamily)

data23 = SMOTE(data[,2:3], as.numeric(data$y))$data

colnames(data23)[3] = "y"
data23$y = as.factor(as.numeric(data23$y)-1)
plot(data23$math, data23$eng,
col=as.numeric(data23$y))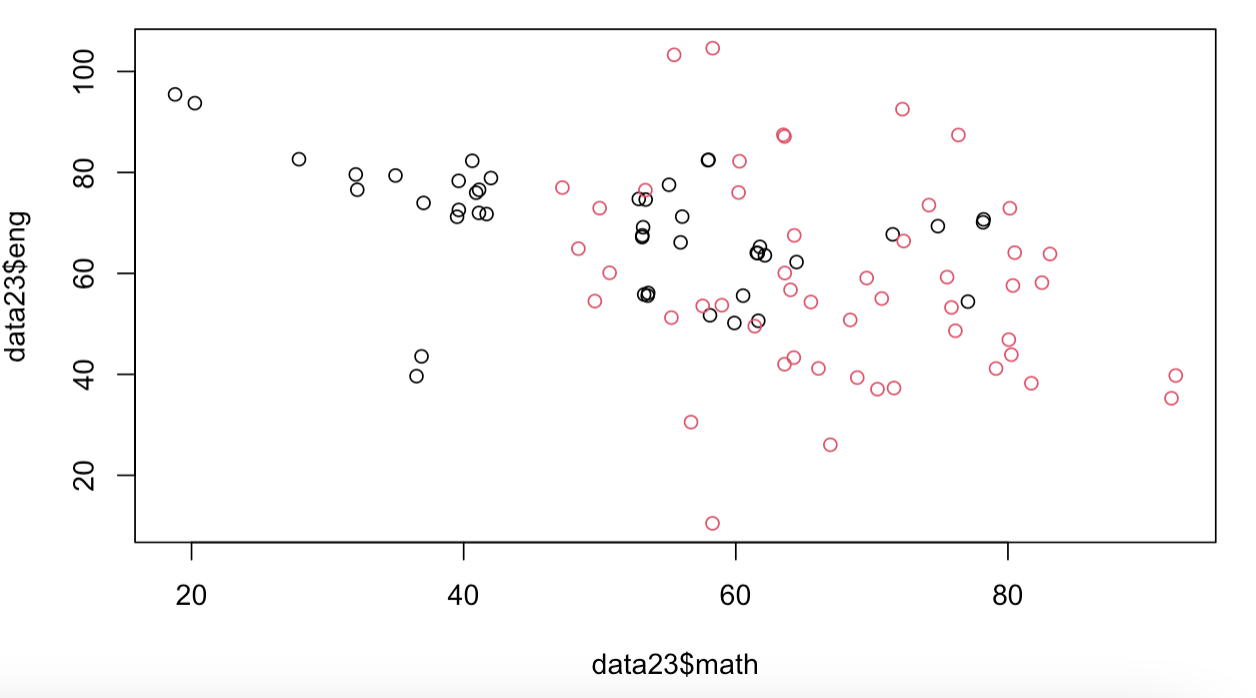
table(data23$y)
>>>  0  1
    45 50
Copyright
- 비어플 빅데이터 학회