
Notice
Recent Posts
Recent Comments
Link
| 일 | 월 | 화 | 수 | 목 | 금 | 토 |
|---|---|---|---|---|---|---|
| 1 | 2 | 3 | ||||
| 4 | 5 | 6 | 7 | 8 | 9 | 10 |
| 11 | 12 | 13 | 14 | 15 | 16 | 17 |
| 18 | 19 | 20 | 21 | 22 | 23 | 24 |
| 25 | 26 | 27 | 28 | 29 | 30 | 31 |
Tags
- 회귀분석
- 데이터 분석
- 이것이 코딩테스트다
- ADsP
- IRIS
- SQL
- 파이썬
- 시각화
- 딥러닝
- tableau
- Deep Learning Specialization
- 자격증
- 이코테
- sklearn
- Google ML Bootcamp
- pytorch
- 태블로
- 데이터분석
- r
- Python
- scikit learn
- 머신러닝
- SQLD
- 코딩테스트
- 통계
- ML
- 데이터분석준전문가
- pandas
- matplotlib
- 데이터 전처리
Archives
- Today
- Total
목록lm (1)
함께하는 데이터 분석
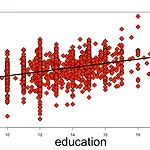 [회귀분석] Simple Linear Regression with R
오늘은 R을 이용하여 simple linear regression을 알아보겠습니다. 데이터는 wages.Rdata를 사용했습니다. 데이터 불러오기 setwd("경로") load("wages.Rdata") attach(wages) setwd를 통하여 자신의 경로를 설정한 다음 load를 통해 경로 안에 있는 파일을 불러오면 됩니다. attach를 통하여 데이터를 불러옴으로써 data.frame에서 column을 wages$logwage가 아닌 logwage라고 쓸 수 있게 됩니다. 데이터 구조 파악하기 str(wages) >>> 'data.frame':2178 obs. of 2 variables: $ education: num 16.8 15 10 12.7 15 ... $ logwage : num 2.85 ..
통계학과 수업 기록/회귀분석
2022. 4. 14. 18:59