Notice
Recent Posts
Recent Comments
Link
| 일 | 월 | 화 | 수 | 목 | 금 | 토 |
|---|---|---|---|---|---|---|
| 1 | ||||||
| 2 | 3 | 4 | 5 | 6 | 7 | 8 |
| 9 | 10 | 11 | 12 | 13 | 14 | 15 |
| 16 | 17 | 18 | 19 | 20 | 21 | 22 |
| 23 | 24 | 25 | 26 | 27 | 28 |
Tags
- 코딩테스트
- tableau
- pytorch
- 딥러닝
- scikit learn
- 데이터분석준전문가
- IRIS
- SQL
- 데이터 분석
- ML
- 이코테
- 시각화
- sklearn
- matplotlib
- 통계
- pandas
- 자격증
- Python
- 머신러닝
- r
- Deep Learning Specialization
- ADsP
- 이것이 코딩테스트다
- Google ML Bootcamp
- 태블로
- SQLD
- 파이썬
- 데이터분석
- 회귀분석
- 데이터 전처리
Archives
- Today
- Total
목록Exploratory Data Analysis (2)
함께하는 데이터 분석
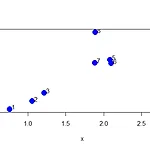
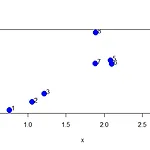 [EDA] K-Means Clustering with R
안녕하세요! 오늘은 EDA수업에서 배우는 또 다른 Clustering 기법인 k-means clustering을 R을 통해 알아보겠습니다. 간단한 좌표 설정 set.seed(1234) #rnorm으로 생성된 값 계속쓰기 위해 고정 x >> [1] 3 3 3 3 1 1 1 1 2 2 2 2 points(x, y, col = kmeansObj$cluster, pch = 19, cex = 2) image() 이용하기 par(mfrow=c(1,2)) #그래픽 1행 2열로 보이게 image(t(dataFrame)[, nrow(dataFrame):1], yaxt = "n", main = "Original Data") image(t(dataFrame)[, order(kmeansObj$cluster)], yaxt = ..
통계학과 수업 기록/EDA
2022. 2. 2. 01:42